Ontology
The living map of your business — metrics, entities, conventions, and the relationships between them. This is why answers are defensible.
The ontology is the platform's understanding of your business. It's the difference between "a chatbot reading a CSV" and a system that knows what your numbers actually mean.
What's in an ontology
An ontology is a typed graph made of five kinds of atoms:
- Metrics — measurable quantities with a formal definition (e.g. Net Revenue = Gross Revenue − Returns − Discounts).
- Entities — the nouns of your business (Customer, Order, Campaign, Channel, Rep, SKU).
- Concepts — recurring abstract things (New Customer, Activated User, At-Risk Account).
- Conventions — the rules you operate under (financial year, currency, time grain, segments).
- Glossary terms — words your team uses that aren't formal metrics (e.g. "premium tier", "T1 city").
Every atom has a definition, a source (where it came from), a trust level, and links to other atoms it depends on.
Where it comes from
The ontology is built two ways at once:
- From templates. When you pick a project function and a vertical pack, the platform seeds the ontology with first-principles definitions — e.g. "AOV = Revenue / Orders." These start as priors.
- From your data. As sources are added, the platform learns: "the
customer_idcolumn appears in three files, so Customer is the central entity here." Learned atoms join the ontology as candidates, awaiting review.
You stay in control. Candidates go to a Review queue where you accept, defer or reject them.
The Ontology page
Open Ontology in the sidebar. You'll find sub-tabs for the different views:
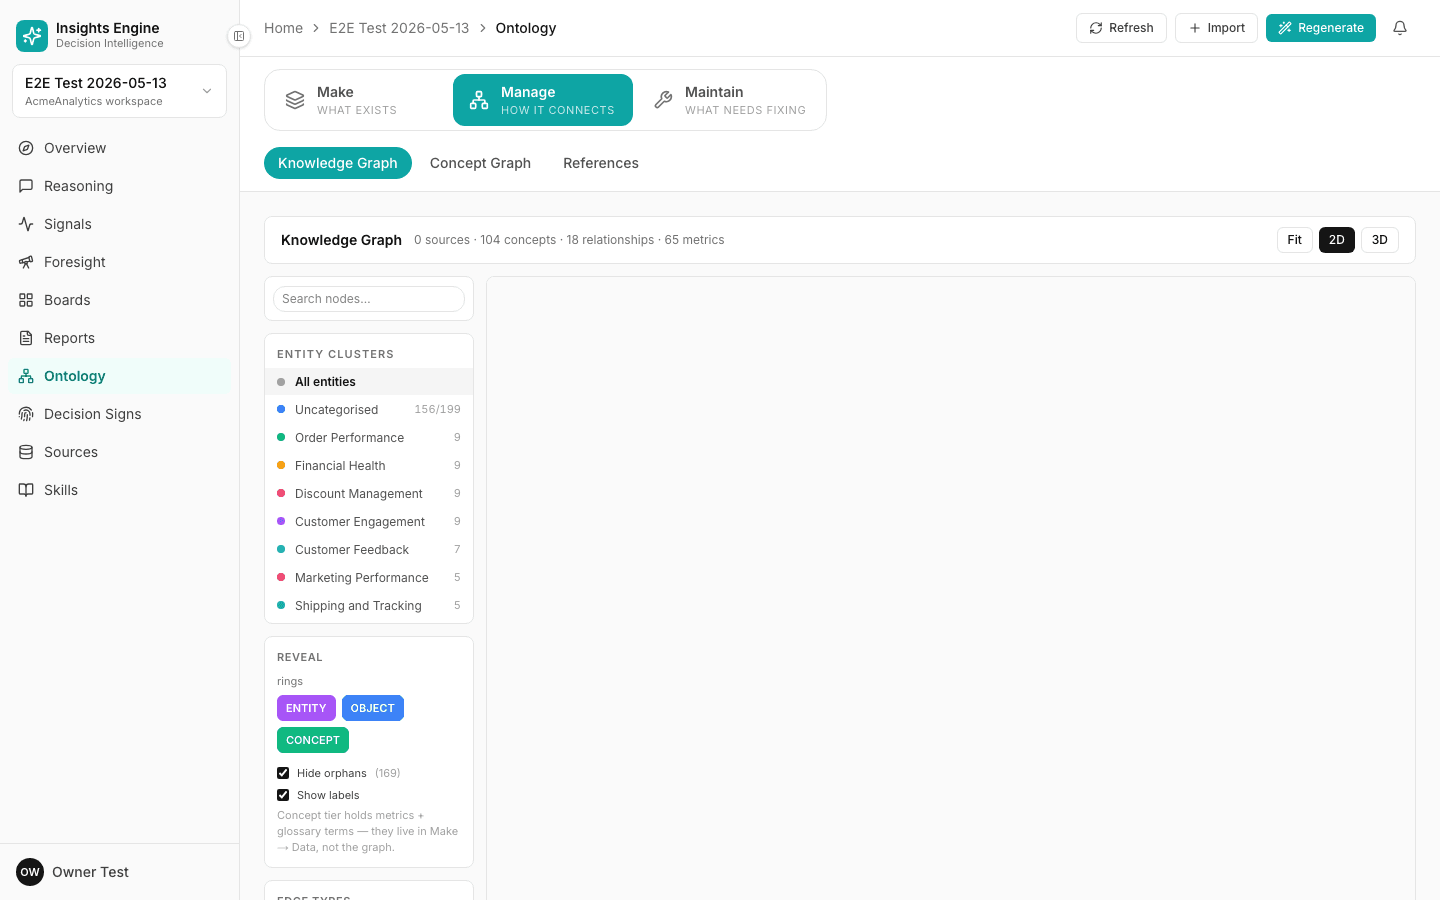
What's on the Ontology screen
Sidebar → Ontology. The page is organised as three top-level modes, picked from a switcher near the top:
Make — "What exists"
The authoring + build-trigger surface. Four sub-tabs:
- Data (default) — Domain Glossary of derived atoms (metrics, entities, concepts) with their formal definitions. Shows term name, expanded meaning (with the actual SQL where applicable), and type. Counter at the top, e.g. "380 terms". + Add term button to author by hand.
- Glossary — same atoms in a sortable list view (overlap with the
/glossaryroute). - Decisions — past decisions that pin atoms to specific definitions.
- Patterns — recurring question patterns and the ontology paths they take.
Above the sub-tabs you'll see two prominent cards:
- Sources changed since last build — banner with timestamp (e.g. "Sources changed since last build (22d ago): 25 added.") and a Rebuild → button. This is your prompt to refresh the ontology against new data.
- Build Ontology — "Runs the 10-phase pipeline over your project's ready sources." with a Build Ontology → button.
Top-right of the whole Ontology page: Refresh, + Import, ✨ Regenerate buttons + Show assistant to open the inline AI helper.
Manage — "How it connects"
The default landing tab. Three sub-tabs:
- Knowledge Graph — a 2D or 3D interactive graph of atoms and their relationships. Stats line at the top: "0 sources · 75 concepts · 219 relationships · 305 metrics". View toggle: Fit / 2D / 3D. Search nodes... input. Left rail lists Entity Clusters — auto-derived groupings:
- All entities
- Data Lineage & Sources
- Governance, Conventions & Decisions
- Paid Acquisition & Ad Performance
- Commerce Performance
- Product & Margin Health
- Trends & Forecasting
- Customer Lifetime & Retention
- Uncategorised
- Concept Graph — alternate view focused on concept relationships (broader than the typed knowledge graph).
- References — external definitions you've imported.
Maintain — "What needs fixing"
The hygiene surface. Five sub-tabs:
- Health — drift indicators, coverage gaps, stale atoms.
- Conflicts — places where two sources or two definitions disagree (e.g. "Channel =
utm_source" vs "Channel =acquisition_source"). Resolve to keep answers consistent. - Review — pending candidate atoms learned from data. Accept / Defer / Reject each one.
- Promotion — the Promotion Inbox, where Data Analysts (Ontology Admins) review project sources / atoms requested for promotion to the workspace-wide canonical layer. Empty state: "No pending promotion requests. The Data Analyst inbox is clear." Pending / All toggle. See Use the workspace library.
- Versions — every change to the ontology, in order. Useful for auditing why a definition shifted.
Other surfaces under Ontology
- Glossary — sortable list of every atom (also reachable via the legacy
/glossaryroute). - Coverage — a scorecard of how well the ontology covers your business (Structure, Semantics, Atoms, Decisions, Insights).
Why this matters
Three things become possible because of the ontology:
- Defensibility — every answer cites the metric definition used to compute it. Two people asking the same question get the same answer.
- Consistency — "Net Revenue" means one thing across every project that subscribes to the canonical definition.
- Drift detection — when source data starts disagreeing with a defined metric (e.g. a new column changes what counts as a "new customer"), the platform raises a conflict for you to resolve.
Versioning and decisions
When you change an atom — accept a candidate, reject a conflict, edit a definition — the change is versioned. The history is preserved. Past answers continue to cite the version of the atom they were built on, so they remain defensible.
When a definition has a real business reason behind it ("we count revenue net of returns because finance does"), you can attach a decision to that atom — the rationale is then permanently attached to every future use.
Day-to-day
For most users, the ontology runs itself. You'll mostly interact with it when:
- A new source triggers a candidate worth reviewing.
- A conflict between sources needs a call.
- You want to look up exactly how a metric is defined before quoting it externally.
Read more in the Glossary reference.