Core concepts
Reports
Compile decisions, trackers and answers into a shareable, defensible summary.
A report is a packaged summary of work the platform has done — decisions, tracker results, reasoning answers, charts — assembled into a document you can share with stakeholders.
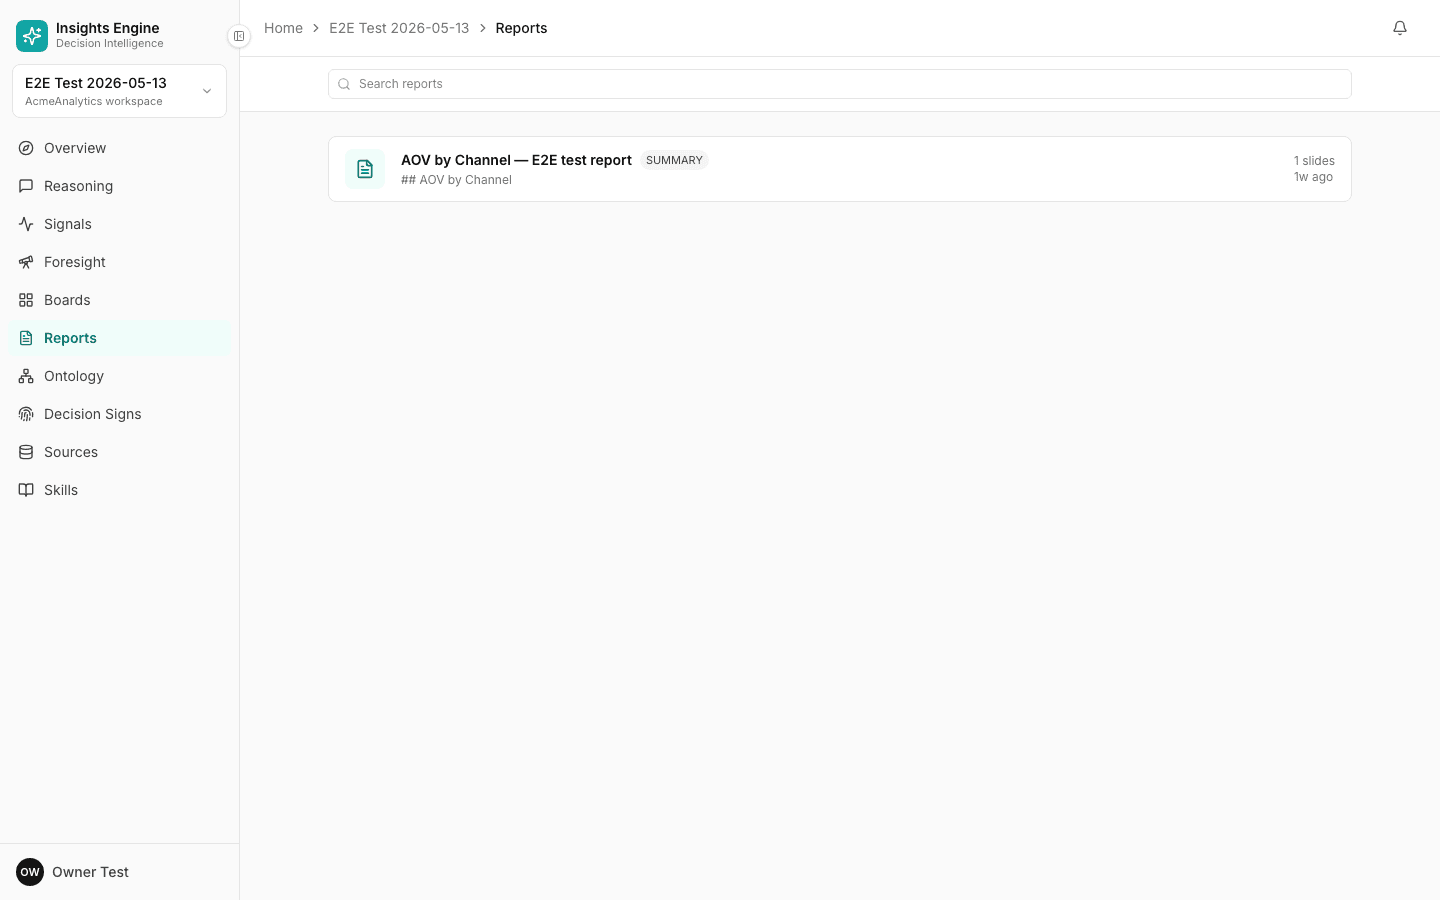
What's on the Reports screen
Sidebar → Reports.
- Search reports input at the top.
- List of reports in the project. Empty-state copy: "Reports compile decisions, trackers, and charts into shareable summaries. Generate one from any Decision via the Generate report button on the decision detail page, or save a Reasoning answer as a report via the Save as report toolbar."
- Two CTAs in the empty state: Browse decisions → and Open Reasoning →.
When to use a report
- Quarterly business reviews — pull in the decisions, trackers and outcomes from the quarter.
- Decision retrospectives — capture the call, the evidence, the outcome, the learning.
- Stakeholder updates — turn a long reasoning answer into something a non-user can read.
- Hand-offs — when a project changes ownership.
Generating a report
Two starting points:
- From a decision. On a decision's detail page, click Generate report — the platform pulls together the question, the answer, the assumptions, the rationale and the actions.
- From a reasoning answer. Click Save as report in the answer toolbar.
You can also create a report from scratch on the Reports page.
What's in a report
A typical report has:
- Title and description — usually auto-generated, editable.
- Type — summary, decision, QBR, retro, custom.
- Slides / sections — multiple panels, each with a heading, a body, optional charts, and citations.
- Citations — every claim ties back to a source version, just like in Reasoning.
Sharing
Reports are shareable inside your workspace. You can also export a static version (PDF or slide deck) for external sharing — the citations become footnotes in the export so the document is still defensible standalone.
Tips
- Don't write reports from scratch if you don't have to. The "Save as report" path on an answer is faster and preserves the citation trail.
- Group related decisions into one report. A QBR with eight decisions tells a story; eight individual reports get lost.
- Mention the trackers. Embedding a tracker chart in a report keeps the live signal alongside the decision history.