Boards
Pin charts and answers from Reasoning into a single shareable view. Boards are how a one-off answer becomes a standing dashboard.
A Board is a curated collection of charts and answer fragments pinned from Reasoning runs. Think of it as the dashboard that emerges after you've asked the right questions — populated by clicking Pin to board on the charts you want to keep.
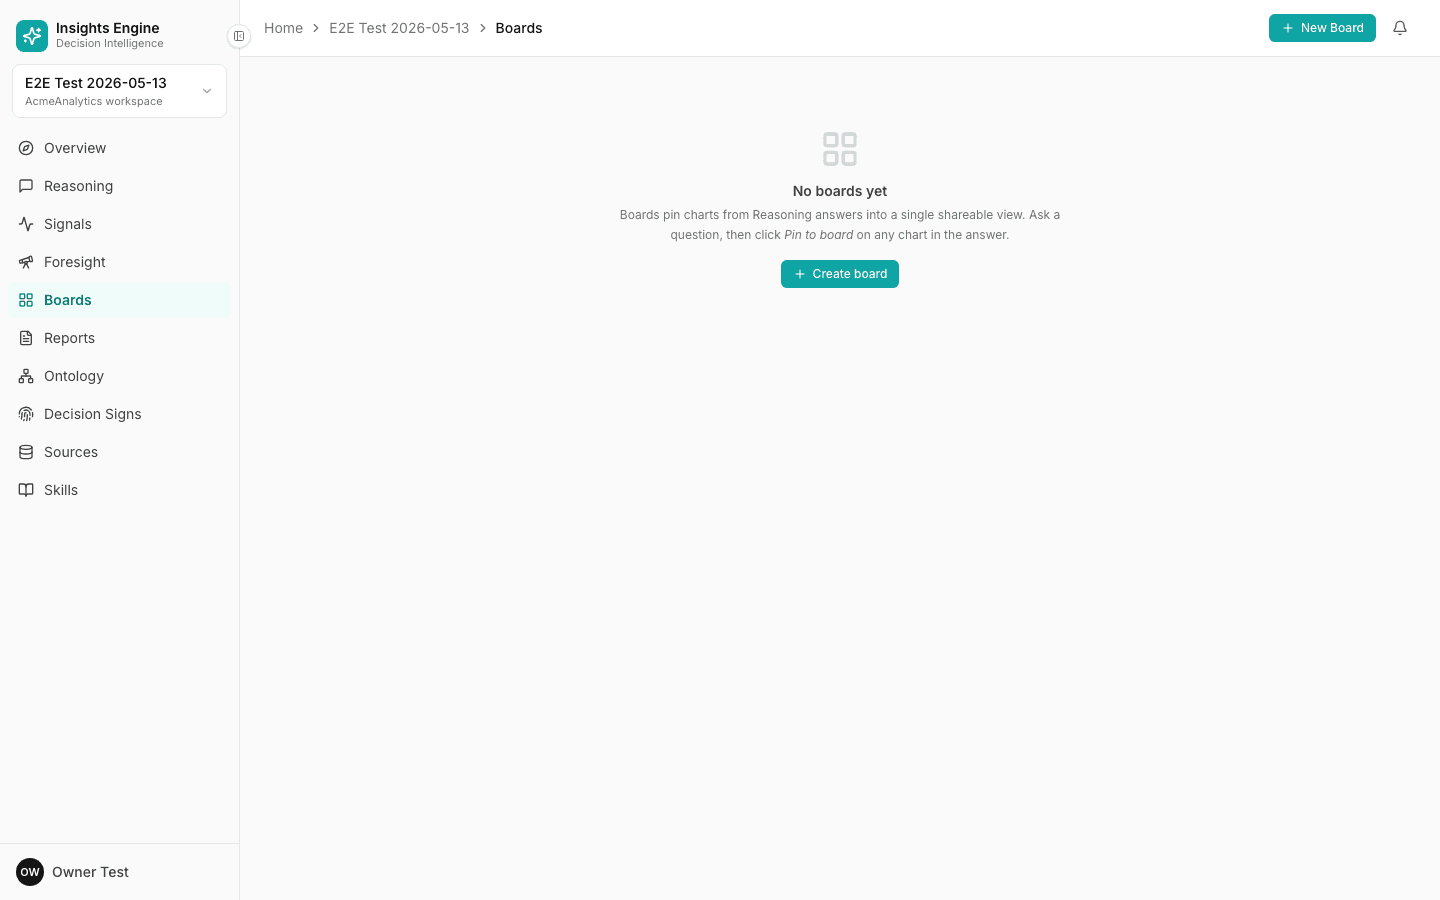
Where to find it
Sidebar → Boards.
What's on this screen
- List of boards in the project (empty state when none exist).
- + New Board button (top-right) — create a board manually.
- + Create board CTA in the empty state.
- Empty-state copy explains the canonical pattern: "Boards pin charts from Reasoning answers into a single shareable view. Ask a question, then click Pin to board on any chart in the answer."
How a board gets populated
- Ask a question in Reasoning and get an answer back.
- The answer includes one or more charts in its evidence section.
- On any chart, click Pin to board.
- Pick an existing board or create a new one inline.
- The chart appears on that board with the source question preserved as context.
Each pinned item keeps a back-link to the original Reasoning run, so anyone reading the board can drill in to the underlying analysis.
Boards vs Reports vs Trackers
These three surfaces often get confused. They're different by intent:
| Surface | Cadence | Purpose |
|---|---|---|
| Boards | Continuous, ad-hoc | A living dashboard. Pin things as you find them. Reorder freely. Share the link. |
| Reports | Point-in-time | A snapshot for a specific moment (QBR, decision retrospective). Static once published. |
| Trackers (sidebar: Signals) | Scheduled | A recurring question that runs on a cadence and classifies each result. |
A common workflow: a Tracker surfaces something in the Overview's Triage lane → you ask a follow-up in Reasoning → pin the chart to a Board → write up the call as a Decision → compile into a Report.
Sharing a board
Boards are scoped to the project. Anyone with access to the project sees the board. There is currently no cross-project board sharing.
To share with someone outside the project's team, generate a Report from the board's contents instead — reports support PDF/slide-deck export.
Tips
- Keep a board narrow. "Q3 Growth", not "Everything Marketing". Narrow boards stay readable.
- Re-order intentionally. The order of pinned items is the order the reader follows. Put the headline chart at the top.
- Re-pin instead of re-asking. When a chart goes stale, click "Refresh" on the pin — it re-runs the underlying question against current data.
- Use boards to drive QBRs. Pin throughout the quarter; the QBR write-up reads itself off the board.
Related
- Reasoning — where the charts come from
- Reports — point-in-time, exportable
- Trackers (Signals) — scheduled questions